|
|
Leverage Your Technology and Increase Productivity |
|
|

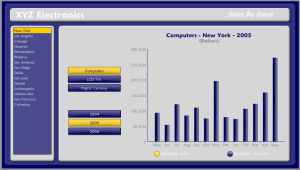
Make interactive presentations from your spreadsheetsTurn your excel spreadsheets into professional looking business dashboards. Visual Business Dashboards combine data analysis and reporting by creating a visual interactive presentation of your data.
Business Dashboards give your audience the power to interact with the data thereby delivering more intelligent analysis and information for better business decisions The Flash animated dashboard can be inserted into Powerpoint files, PDF files, web pages and outlook emails for easy distribution and sharing within your organization.
Support info at powerpointguru.com |

| © 2007
Slideshow |
|
PowerPoint is a registered trademark of Microsoft Corporation. All other trademarks belong to their respective owners.